24/04/2017
New all-scatterometer winds viewer
-
Forecasters and other users are usually interested in the winds near a storm, location or facility, but are faced with collecting information through many “clicks”. Recently, however, the OSI SAF winds team at KNMI has developed a new visualization tool which gives easy access to near-real time OSI SAF winds from all available instruments on one web page in a known meteorological context. Our goal was to create a fast, location-based access, rather than access based on instrument or product.
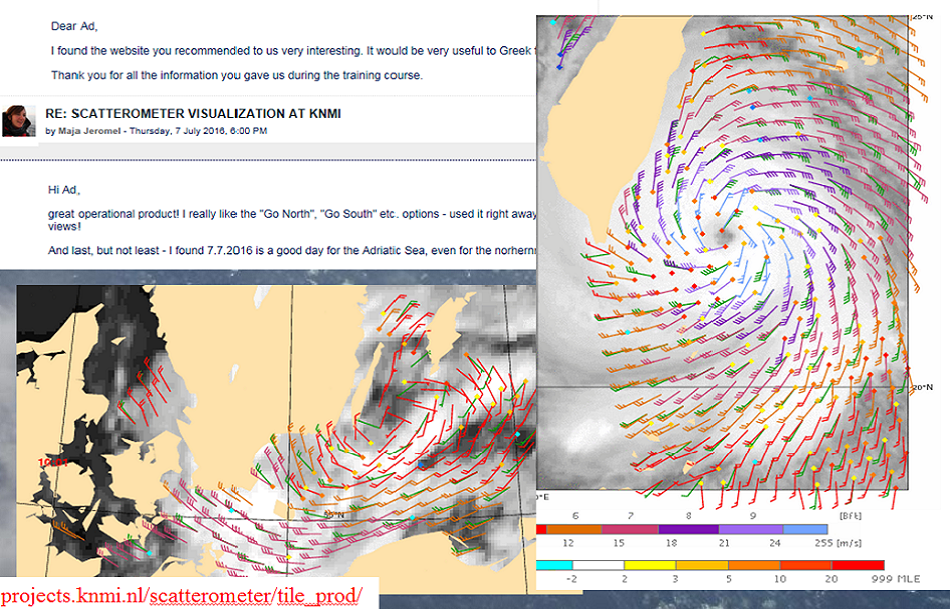
The visualization is accessible without registration and using any browser by simply going to http://projects.knmi.nl/scatterometer/tile_prod/. One can click on a region of interest (tile) and all available scatterometer winds of the last 24 hours covering that region are displayed. A detail plot showing the winds of the most recent overpass is shown and earlier overpasses can be selected in the right hand side menu. The plots also shows ECMWF numerical weather prediction model forecast winds valid at the scatterometer Wind Vector Cell position and time, and an infrared cloud image from a geostationary satellite.
The current viewer displays winds from ASCAT on Metop-A and Metop-B, but scatterometer winds from ISRO’s ScatSat-1, are being incorporated. In 2018, further scatterometers are expected to become available, i.e., WindRad on FY3E, SCAT on CFOSAT and ASCAT-C, resulting in an improved temporal coverage of each tile.
The viewer was developed in close collaboration with shift meteorologists at KNMI and in Europe, who provided feedback on the best way to visualize the winds, e.g., regarding to colour coding of the winds and other features.
-
-